Core Web Vitals for Australian Business Owners
What LCP, INP and CLS measure, Google's thresholds, how to check your own site, and what our Canberra study found: 25 of 60 sites passed on phones.
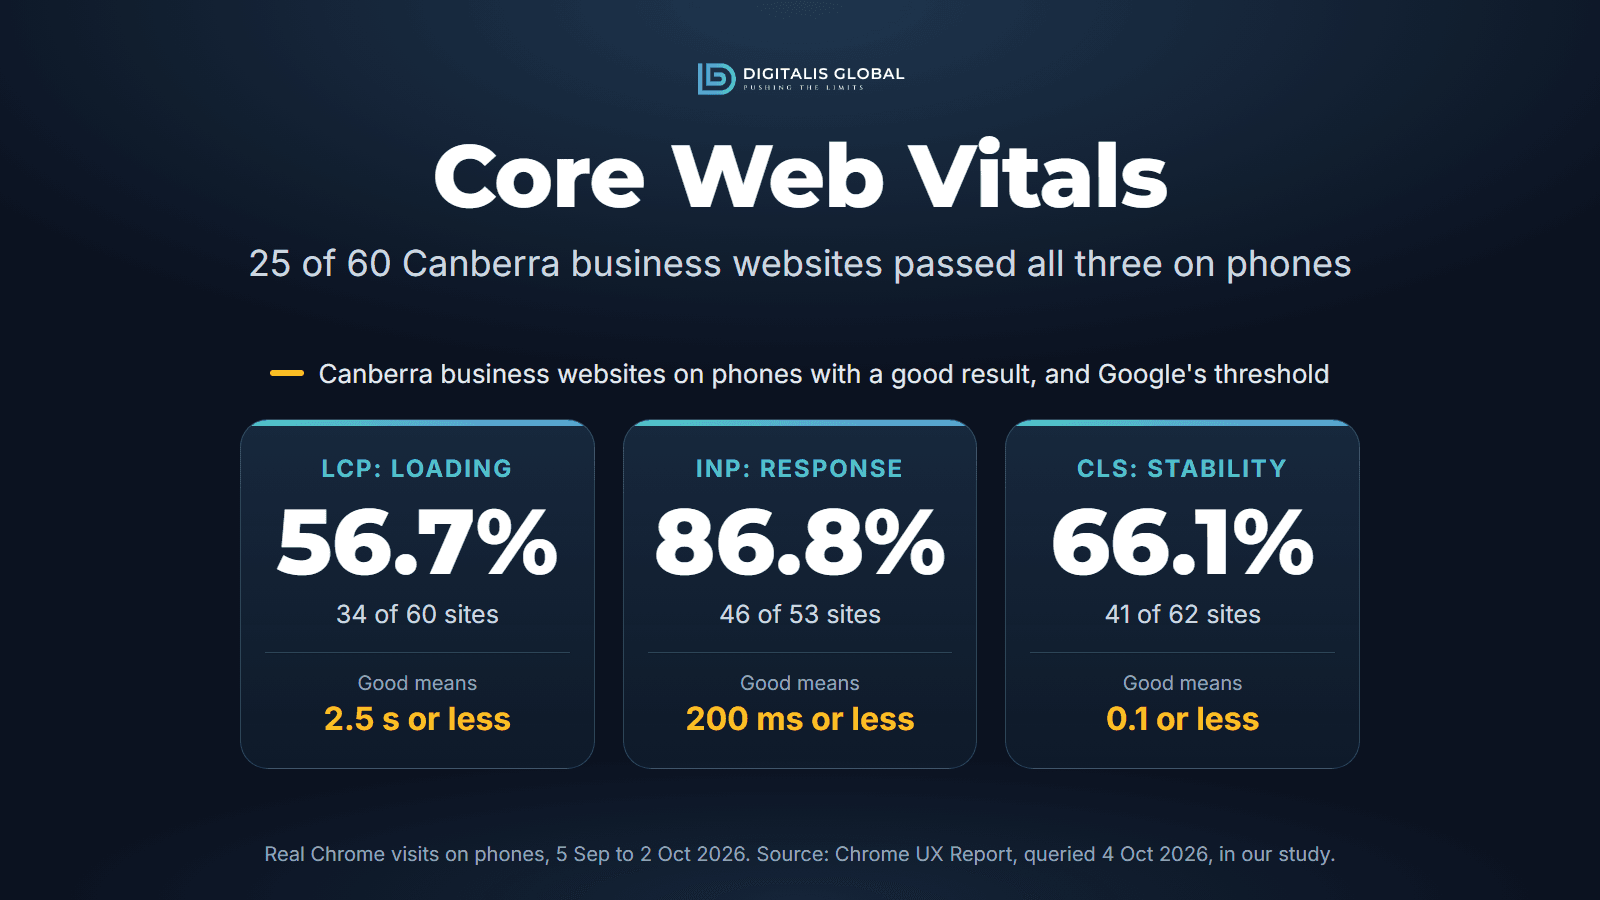
Core Web Vitals are three measurements Google uses to describe how a page feels to the people using it: Largest Contentful Paint (LCP) for loading, Interaction to Next Paint (INP) for responsiveness and Cumulative Layout Shift (CLS) for visual stability. A page is in good shape when, for at least three in four visits, LCP is 2.5 seconds or less, INP is 200 milliseconds or less and CLS is 0.1 or less (web.dev, Web Vitals, last checked 5 October 2026). In our study of Australian business websites, which starts with Canberra, 25 of the 60 sites Google could assess on phones passed all three, measured on real Chrome visits from 5 September to 2 October 2026, and loading was the measure sites missed most often. This guide explains each measure, what Google says about rankings, how to check your site and what usually fixes each one.
The three Core Web Vitals in plain English
Each measure has three bands. These are Google's thresholds as web.dev publishes them, last checked 5 October 2026.
| Measure | What it measures | Good | Needs improvement | Poor |
|---|---|---|---|---|
| LCP: loading | How long until the largest image, text block or video in view has appeared | 2.5 seconds or less | Over 2.5 seconds, up to 4.0 seconds | Over 4.0 seconds |
| INP: responsiveness | How quickly the page responds to clicks, taps and key presses, across the whole visit | 200 milliseconds or less | Over 200, up to 500 milliseconds | Over 500 milliseconds |
| CLS: visual stability | How much the layout jumps unexpectedly while the page is in use | 0.1 or less | Over 0.1, up to 0.25 | Over 0.25 |
Sources: web.dev on LCP, INP and CLS, all last checked 5 October 2026.
Google judges each measure at the 75th percentile of page loads, separately for phones and desktops. In practice a page passes LCP only if at least three in four visits see the main content within 2.5 seconds, so a fast office computer on a good connection tells you little about a customer on a phone. INP counts clicks, taps and key presses, not hovering, scrolling or zooming. It replaced an older measure, First Input Delay, as a Core Web Vital on 12 March 2024 (web.dev, last checked 5 October 2026), so a report that still grades your site on First Input Delay is out of date.
Do Core Web Vitals affect your Google rankings?
They count, but relevance counts for more. Google recommends that site owners achieve good Core Web Vitals for success with Search, and says they line up with what its core ranking systems seek to reward (Google Search Central, Core Web Vitals, updated 10 December 2025). Its page experience guidance then sets three limits: there is no single page experience signal, Google still shows the most relevant page even when its experience is poor, and good results in Search Console or any other tool do not guarantee a top ranking. Where many pages answer a search well, a good page experience can help, and Google generally judges it page by page (Google Search Central, Understanding page experience, updated 22 September 2026). Both pages were last checked on 5 October 2026.
The better reason to care is the visitor. Each measure describes something they live through: waiting for the offer to appear, a button that does nothing when tapped, or a layout that moves just as they tap. Those are worth fixing whatever they do to rankings.
What we found on Canberra business websites
For our study of Australian business websites we drew a random sample of 200 websites from the 804 Canberra business websites mapped in OpenStreetMap. On 4 October 2026 we asked Google's Chrome UX Report about each one. Its phone data covers real Chrome visits from 5 September to 2 October 2026, and only 63 of the 200 sampled sites (31.5%) had any. The results for those sites:
| On phones | Sites with a good result | Median of each site's 75th percentile |
|---|---|---|
| Passed Core Web Vitals | 25 of 60 (41.7%) | Not a single figure: a pass needs all three |
| Good LCP (loading) | 34 of 60 (56.7%) | 2,252.5 ms, against a threshold of 2,500 ms |
| Good INP (responsiveness) | 46 of 53 (86.8%) | 122 ms, against 200 ms |
| Good CLS (visual stability) | 41 of 62 (66.1%) | 0.03, against 0.1 |
Source: Chrome UX Report, origin level, real Chrome visits on phones from 5 September to 2 October 2026, queried 4 October 2026, as published in our study. A site needs both an LCP and a CLS figure to be assessed, which is why the bases differ.
Three things stand out. Fewer than half of the assessable sites passed on phones. Responsiveness was rarely the problem: 46 of 53 sites had a good INP, while loading was the measure most often missed, with only 34 of 60 sites at a good LCP. And the typical site was close to the line on loading: the median site's LCP was 2,252.5 ms against a threshold of 2,500 ms, so for many sites the gap to a good LCP looks small. That is our reading of the median; the data does not show it for any one site.
Read the figures as a pilot: OpenStreetMap leans towards shopfronts, the report covers only sites with enough Chrome traffic, and the 95 per cent interval on the pass rate runs from 30.1% to 54.3%. The study page has every count and definition, and the CSV.
Why many sites have no Core Web Vitals data
Google only puts a site in the Chrome UX Report, the dataset behind every Core Web Vitals figure, when it is publicly discoverable and sufficiently popular. A page served with a noindex tag is not discoverable, and Google does not publish the visitor threshold for popularity (Chrome UX Report methodology, last checked 5 October 2026). That is why only 63 of our 200 Canberra sites had phone data at all. Combining phones, desktops and tablets gives more sites enough traffic: 115 of 200 (57.5%) had data across all devices, and 59 of 110 (53.6%) of those assessed passed.
There is a second gap that matters in Australia. The report collects data only from Chrome on desktop computers and Android devices; Chrome on iOS is excluded (Chrome UX Report methodology), and it is a Chrome dataset, so Safari visits are not in it either. StatCounter put Apple's share of mobile page views in Australia at 62.58% in September 2026 (StatCounter Global Stats, mobile vendor market share in Australia, read 5 October 2026; StatCounter measures page views across the sites that use its tracker). So the phone figures for an Australian site describe its Android visitors, and on StatCounter's measure most phone traffic here comes from iPhones the report never hears from. Test on an iPhone as well.
No data does not mean your site is slow or fast. It means Google has nothing to grade, so use a lab test as a guide.
Field data and lab scores are not the same thing
Google's tools show both, often on the same screen, and mixing them up causes most of the confusion about site speed.
| Field data (Core Web Vitals) | Lab data (Lighthouse score) | |
|---|---|---|
| Where it comes from | Real Chrome visits, as a 28-day rolling average updated daily | One simulated page load on a single device and network setting |
| Measures INP | Yes | No: a simulated load has no user to interact with |
| Which sites | Only sites with enough Chrome traffic | Any page you can load |
| How it is graded | Passes when the 75th percentile of all three is good, or of LCP and CLS when there is too little INP data | 90 or above good, 50 to 89 needs improvement, below 50 poor |
| Best used for | Knowing what your visitors actually get | Finding causes and testing a fix before it goes live |
Sources: Chrome UX Report API, About PageSpeed Insights, web.dev, Web Vitals and Lighthouse performance scoring, all last checked 5 October 2026.
A lab score also moves between runs. Google lists A/B tests, changing ads, internet routing, the device used, browser extensions and antivirus software among the causes (Lighthouse performance scoring). Our study ran one Lighthouse test on 4 October 2026 for each Canberra site without phone field data whose homepage we could read. Of the 105 that returned a score, the median was 60 out of 100; 7 of 105 (6.7%) scored 90 or more, 72 of 105 (68.6%) scored 50 to 89 and 26 of 105 (24.8%) scored below 50. Those are lab scores for different sites from the field figures above, so the two sets cannot be compared as one group.
How to check your own site
Three Google tools cover it. Google Search Console is a free Google service (About Search Console, last checked 5 October 2026).
| Tool | Data | What it tells you |
|---|---|---|
| PageSpeed Insights | Field data where it exists, plus one lab run | Whether one page passes. When a page has too little data it falls back to the whole site, and when the site has too little it shows no field data. |
| Search Console, Core Web Vitals report | Field data | Groups of similar pages rated Good, Need improvement or Poor, for phones and desktops separately. A group takes the status of its slowest measure. |
| Lighthouse in Chrome DevTools | Lab data | Where the time goes on one load, so a developer can find causes. |
Sources: About PageSpeed Insights and the Core Web Vitals report help page, both last checked 5 October 2026.
- Test your homepage and your busiest page on mobile in PageSpeed Insights. Note which of the three measures fails, if any, in the field data.
- If there is no field data, treat the lab result as a guide to causes, not a grade, and load the page on a real phone, an iPhone included.
- Open the Core Web Vitals report in Search Console to see which groups of pages share the problem. One template usually serves many pages, so one fix can move a whole group.
- After a fix, start tracking it in the report, which runs a 28-day monitoring session, and expect the field data to take about that long to catch up, because it is a 28-day rolling average.
What usually fixes each one
These are the fixes web.dev's optimisation guides lead with (last checked 5 October 2026). Most need a developer, but knowing them helps you judge the advice you get.
-

Loading · LCP
Get the main image or heading on screen sooner
- Most often missed in our Canberra sample
- Usually: images and server response
Web.dev splits LCP into four parts: the server's first response, the wait before the main image starts loading, its download time and the delay before it is drawn. The common fixes: never lazy-load the main image, mark it as high priority with fetchpriority="high", serve it at the size it is shown in a modern, compressed format, and use a content delivery network (web.dev, Optimize LCP).
-

Responsiveness · INP
Make taps and clicks answer quickly
- Rarely the problem in our Canberra sample
- Usually: long JavaScript tasks
An interaction has three parts: the wait before the page starts handling it, the handling itself and the time to draw the result. Long JavaScript tasks are the usual cause, so developers break them up and hand control back to the browser between steps, and keep the page's HTML lean (web.dev, Optimize INP).
-

Visual stability · CLS
Stop the layout jumping
- Usually: images, embeds and fonts
Web.dev names the usual causes as images without dimensions, ads, embeds and iframes without reserved space, content injected after the page loads, and web fonts. Give every image and video a width and height, reserve space for ads and embeds, avoid pushing content in above what people are reading, and load key fonts early (web.dev, Optimize CLS).
What does not help much
- Chasing a Lighthouse score of 100: it is one simulated load, it cannot measure INP and it moves between runs.
- Testing only on a fast office computer: Google grades the slower visits, at the 75th percentile, on phones and desktops separately.
- Expecting results overnight: field data is a 28-day rolling average.
- Treating a pass as a ranking promise: Google says good results in its reports do not guarantee a top ranking.
What to ask your developer
- Which of the three measures fails, on which page templates, and is that from field data or a lab test?
- What is the main image or text block on each key template, and how is it loaded?
- Which third-party scripts load on every page (chat, tracking, booking widgets), and does each one still earn its place?
- Do all images, videos and embeds have reserved space?
- How will you show the fix worked: the Search Console report, or the field data in four weeks' time?
If you would rather hand it over, a Core Web Vitals check is part of the technical audit in our technical SEO service, and our web development team tests each page template with Google Lighthouse before launch. We do not promise a speed score, because third-party scripts, hosting and images added after launch all change it. Both are quoted after a scoping call, as our pricing page explains, and our website cost guide shows where performance work sits in a rebuild quote.
Common questions
What is a good Core Web Vitals score?
There is no single score: a page is good when all three measures are in the good band at the 75th percentile of visits, and the 0 to 100 number many tools show is a Lighthouse lab score, not a Core Web Vital.
Why does PageSpeed Insights show no field data for my site?
Because the Chrome UX Report has too few Chrome visits to your site, or the site is not publicly discoverable; in our Canberra sample only 63 of 200 business websites had phone data, so this is common for small sites and says nothing about whether yours is fast.
Is the PageSpeed Insights performance score a Core Web Vital?
No. It comes from one simulated Lighthouse load, it cannot measure INP because nobody interacts with the page, and it varies between runs; the Core Web Vitals assessment is the field data section, shown only when Google has enough real visits.
Do iPhone visits count towards Core Web Vitals?
No. The Chrome UX Report collects from Chrome on desktop and Android only and excludes Chrome on iOS (Chrome UX Report methodology, last checked 5 October 2026), so test on an iPhone yourself.
How long do fixes take to show in Core Web Vitals?
Up to about four weeks, because the field data is a 28-day rolling average updated daily (Chrome UX Report API documentation, last checked 5 October 2026); a lab test shows the change straight away, which is why developers use it to check a fix before the field data catches up.
Sources
Study figures are from our Australian business websites study (Canberra: sample drawn 26 September 2026, Chrome UX Report phone and all-device data for 5 September to 2 October 2026 queried 4 October 2026, Lighthouse 13.5.0 lab runs on 4 October 2026). Every page below was read on 5 October 2026.
- web.dev: Web Vitals, LCP, INP, CLS, INP becomes a Core Web Vital, Optimize LCP, Optimize INP and Optimize CLS
- Google Search Central: Core Web Vitals (updated 10 December 2025) and Understanding page experience (updated 22 September 2026)
- Chrome UX Report: methodology and API
- About PageSpeed Insights and Lighthouse performance scoring
- Search Console Help: Core Web Vitals report and About Search Console
- StatCounter Global Stats: mobile vendor market share in Australia (September 2026) and its FAQ on method
Drafted with AI assistance; researched and reviewed by Saad Ali.
Founder / CEO